Part 1: Measures of Central Tendency
Definition: Measures of Central Tendency are statistical tools that summarize a large set of numerical data into a single representative value. This value lies somewhere in the center of the data distribution. The three main measures are the Arithmetic Mean, the Median, and the Mode.
1. Arithmetic Mean (Average)
Definition: The Arithmetic Mean is the sum of all values divided by the number of values. It is the most commonly used average.
Formula (General):
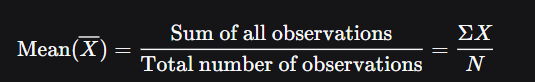
where Σ = Summation, X = Individual values, N= Total number of values.
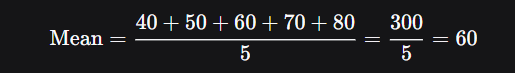
A. Calculation of Mean for Individual Series (Ungrouped Data)
Example: Marks of 5 students: 40, 50, 60, 70, 80.
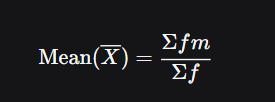
B. Calculation of Mean for Discrete Series (Ungrouped Frequency Distribution)
Formula:
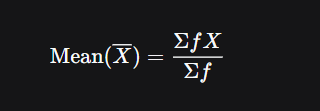
where ff = frequency, XX = value.
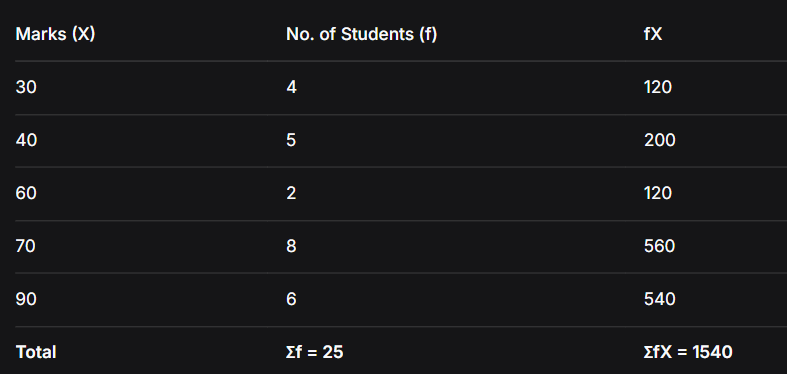
Example:
C. Calculation of Mean for Continuous Series (Grouped Data)
Three methods can be used:
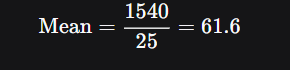
i) Direct Method:
where mm = mid-value of class, ff = frequency.
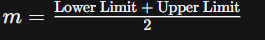
Steps:
Find mid-value (mm) for each class:
Calculate fm for each class.
Use the formula.
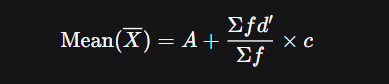
ii) Short-cut Method (Assumed Mean Method):
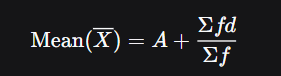
where AA = Assumed Mean (usually the mid-value of the class with highest frequency), d=m−Ad=m−A.
iii) Step-deviation Method:

Example (Grouped Data):
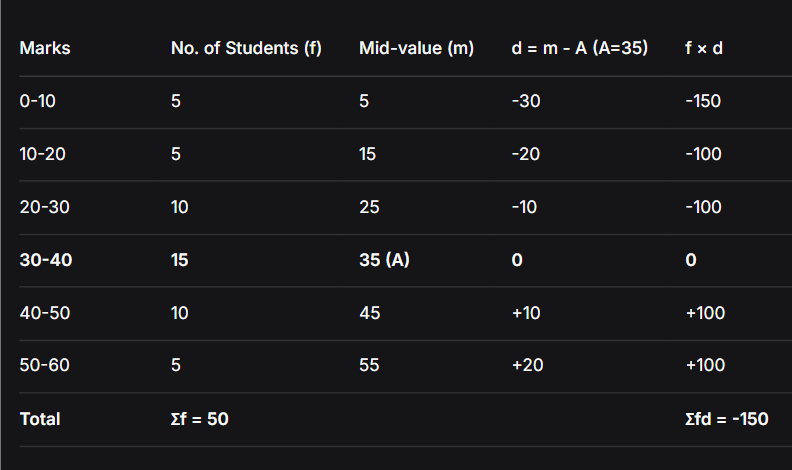
Using Short-cut Method:
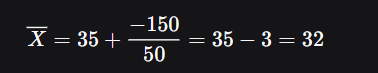
All three methods will give the same result (Mean = 32).
2. Median
Definition: The Median is the middle value when data is arranged in ascending or descending order. It divides the data into two equal halves.
A. Median for Individual Series
Steps:
- Arrange data in ascending order.
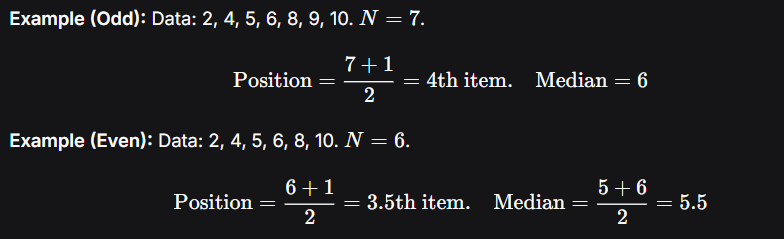
- Use formula: Position of Median=N+12Position of Median=2N+1th item.
- If NN (number of items) is odd, the median is the middle value.
- If NN is even, the median is the average of the two middle values.
B. Median for Discrete Series
Steps:
- Arrange data in ascending order with frequencies.
- Calculate Cumulative Frequency (c.f.).

- Locate this item in the cumulative frequency column; the corresponding value is the median.
C. Median for Continuous Series
Steps:
- Calculate cumulative frequency.
- Find median class: The class where N22Nth item lies.
- Use formula:
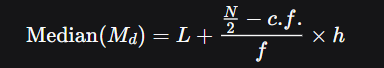
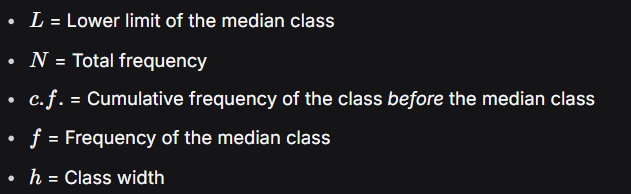
where:
Example:
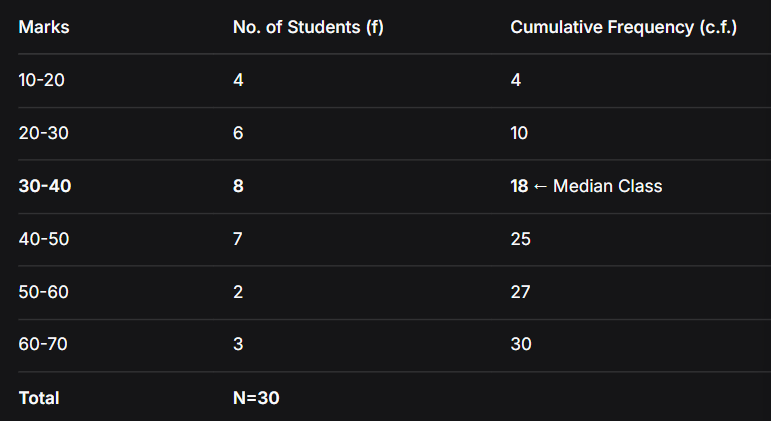
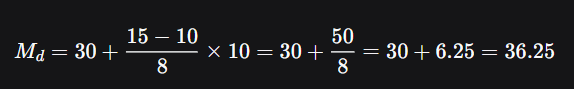
Here, N2=302=152N=230=15. The 15th item lies in the class 30-40 (c.f. reaches 18).
L=30,N/2=15,c.f.=10,f=8,h=10L=30,N/2=15,c.f.=10,f=8,h=10
3. Mode
Definition: The Mode is the value that occurs most frequently in a data set.
A. Mode for Individual Series
Simply identify the value that repeats the most.
Example: Data: 34, 35, 36, 33, 38, 38, 38, 36, 38, 35.
Here, 38 appears most often (4 times). Mode = 38.
- If two values have the same highest frequency, the series is Bi-modal.
- If more than two values have the same highest frequency, use the empirical formula:
- Mode=3×Median−2×MeanMode=3×Median−2×Mean
B. Mode for Continuous Series
Steps:
- Identify the modal class – the class with the highest frequency.
- Use formula:
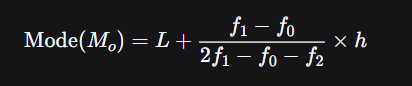
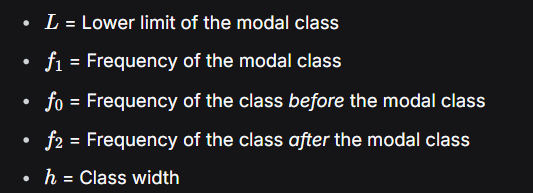
where:
Example:
| Marks | No. of Students (f) |
|---|---|
| 0-20 | 6 |
| 20-40 | 10 |
| 40-60 | 16 (f₁) |
| 60-80 | 8 (f₂) |
| 80-100 | 3 |
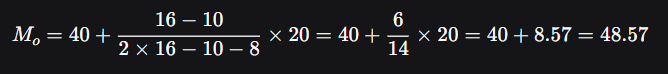
Here, Modal class is 40-60.
L=40,f1=16,f0=10,f2=8,h=20L=40,f1=16,f0=10,f2=8,h=20
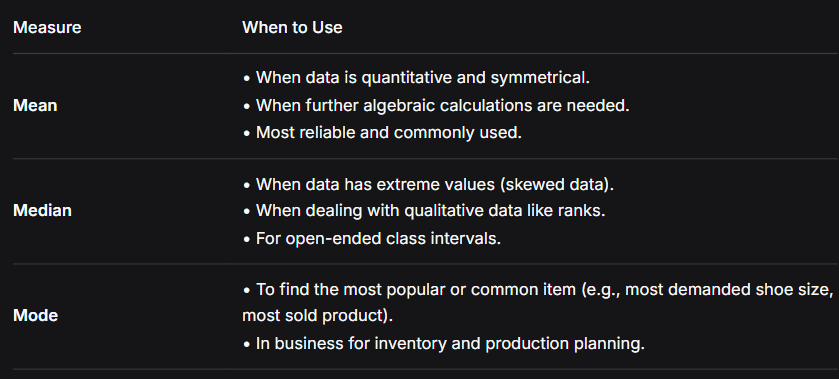
4. Uses of Mean, Median, and Mode
Part 2: Index Numbers
Definition: An Index Number is a special type of average that measures the relative change in a variable (like price or quantity) over time or between places. It is expressed as a percentage.
Example: Consumer Price Index (CPI) measures changes in the price of a basket of goods over time.
1. Price Index Number
It measures the change in the price level of a group of commodities.
A. Simple (Unweighted) Index Numbers
Here, all items are considered equally important.
i) Simple Aggregate Method:
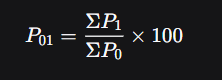
where P1 = Price in current year, P0 = Price in base year, P01 = Price Index.
ii) Simple Average of Price Relatives Method:
First, calculate Price Relative for each item: Price Relative=P1P0×100Price Relative=P0P1×100
Then, take the average:
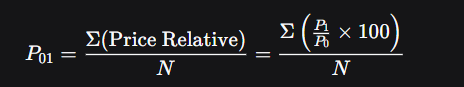
where N = number of items.
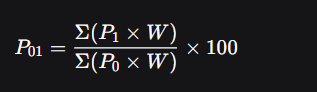
B. Weighted Index Numbers
Here, items are assigned weights (W) according to their importance (e.g., quantity consumed).
General Formula:
Two Important Methods:
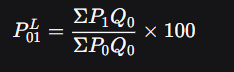
i) Laspeyre’s Method (Base Year Weight):
Uses base year quantities (Q0Q0) as weights.
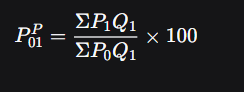
ii) Paasche’s Method (Current Year Weight):
Uses current year quantities (Q1Q1) as weights.
2. Uses and Limitations of Index Numbers
Uses:
- Measure Inflation/Deflation: CPI measures change in the cost of living.
- Wage Adjustment: Used to determine dearness allowance for employees.
- Policy Making: Helps government in framing economic policies (tax, price control).
- Business Decisions: Helps businessmen in forecasting, price setting, and inventory control.
- Compare Groups: Compares standard of living between regions or countries.
Limitations:
- Based on samples, which may not be fully representative.
- Different formulas give different results.
- Quality changes in goods are not considered.
- Selection of base year and weights can be arbitrary and affect the index.
- Comparisons over long periods may be misleading due to changes in consumption patterns.