- Unit 1: Understanding Economic Development
1.1 Economic Development: Meaning and Definition
Meaning:
Economic development is a comprehensive and multi-dimensional process that involves not just an increase in income, but improvement in the overall quality of life of people. It includes:
- Increase in per capita income
- Reduction in poverty and unemployment
- Better healthcare and education facilities
- Improved living standards
- Equal distribution of wealth
- Political stability and freedom
- Sustainable use of resources
Historical Perspective:
The concept of economic development has evolved over time:
1950s-1960s: Focus was only on increase in per capita income
- Economists believed that if a country's per capita income increases, it automatically means development
1970s-Present: Broader perspective emerged
- Development includes: health, education, equality, freedom, environment
- Michael P. Todaro: "Development must be conceived as a multi-dimensional process involving major changes in social structures, popular attitudes, and national institutions as well as the acceleration of economic growth, the reduction of inequality, and the eradication of poverty."
Definitions:
- Prof. G.M. Mier:
"Economic development is a process where the real per capita income of a country increases over a long period of time." - Michael P. Todaro:
"Economic development is defined in terms of the reduction of poverty, inequality, and unemployment within the context of a growing economy." - UNDP Perspective:
"Development is about creating an environment where people can enjoy long, healthy, creative lives."
Key Characteristics of Economic Development:
- Long-term Process: Takes decades, not months or years
- Qualitative Changes: Improvement in human capabilities
- Structural Transformation: Shift from agriculture to industry/services
- Social Inclusion: Equal opportunities for all
- Sustainability: Development without harming future generations
- People-Centered: Focus on human welfare, not just economic numbers
1.2 Economic Growth: Meaning and Definition
Meaning:
Economic growth refers to the increase in the quantity of goods and services produced in an economy over a specific period. It is a quantitative concept measured by:
- Increase in GDP (Gross Domestic Product)
- Increase in GNP (Gross National Product)
- Rise in Per Capita Income
Definitions:
- Michael P. Todaro and Stephen C. Smith:
"Economic growth is defined as the steady process by which the productive capacity of the economy is increased over time to bring about rising level of national output and income." - Jacob Viner:
"Economic growth is an issue of reducing mass poverty." - Simple Definition:
"Economic growth is the increase in the market value of goods and services produced by an economy over time."
Features of Economic Growth:
- Measurable: Can be calculated precisely
- Short-term: Can occur in quarterly or yearly periods
- Economic Focus: Only considers economic aspects
- Can be Unequal: Growth may benefit only certain groups
- Not Always Beneficial: May come with pollution, inequality
- Pre-condition for Development: Usually needed for development
Unit 2: Difference Between Economic Growth and Economic Development
Detailed Comparison:
| Aspect | Economic Growth | Economic Development |
|---|---|---|
| 1. Nature | Quantitative - only numbers | Qualitative & Quantitative - includes values |
| 2. Scope | Narrow - only economic output | Broad - social, political, economic, cultural |
| 3. Time Frame | Short-term - can be quarterly/annual | Long-term - takes decades |
| 4. Measurement | GDP, GNP, Per Capita Income | HDI, PQLI, Basic Needs, Equality indices |
| 5. Focus | Increase in production | Improvement in quality of life |
| 6. Distribution | May ignore equality | Aims for equal distribution |
| 7. Sustainability | May not be sustainable | Emphasizes sustainable development |
| 8. Process | Automatic, can happen quickly | Planned, requires government intervention |
| 9. Example | Nepal's GDP grew by 4% in 2022 | Nepal's HDI improved from 0.54 to 0.60 |
| 10. Outcome | More goods and services | Happy, healthy, educated citizens |
Important Note:
- Growth without Development: A country can have economic growth without development (e.g., rich country with poor education/health)
- Development without Growth: Possible but rare (e.g., Cuba has good HDI but low growth)
- Ideal Situation: Growth with Development
Unit 3: Indicators of Economic Development
3.1 Per Capita Income
Formula: Per Capita Income = National Income ÷ Total Population
Example:
- Nepal's National Income (2022): $36 billion
- Population: 30 million
- Per Capita Income = $36,000,000,000 ÷ 30,000,000 = $1,200
Limitations:
- Doesn't show income distribution (rich may get richer)
- Doesn't consider non-monetary benefits
- Ignores quality of life aspects
3.2 Physical Quality of Life Index (PQLI)
Components:
- Life Expectancy at Age 1
- Infant Mortality Rate
- Literacy Rate
Calculation:
Each component scored 0-100, then averaged
Interpretation:
- 0-50: Low development
- 51-75: Medium development
- 76-100: High development
Example (Nepal approximately):
- Life Expectancy: 71 years → Score: 70
- Infant Mortality: 28 per 1000 → Score: 72
- Literacy: 68% → Score: 68
- PQLI = (70+72+68)/3 = 70 (Medium development)
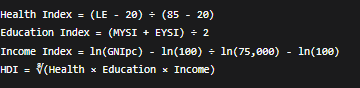
3.3 Human Development Index (HDI) - Most Important
Developed by: United Nations Development Programme (UNDP)
Three Dimensions:
1. Health: Life Expectancy at Birth
- Nepal: 71 years
- Formula: (Actual - Minimum) ÷ (Maximum - Minimum)
- Min = 20 years, Max = 85 years
2. Education:
- a) Mean Years of Schooling (Adults 25+)
Nepal: 4.9 years
Max = 15 years - b) Expected Years of Schooling (Children)
Nepal: 12.2 years
Max = 18 years
Education Index = Average of both
3. Standard of Living: GNI Per Capita (PPP $)
- Nepal: $3,457 (2021)
- Formula: log(actual) - log(min) ÷ log(max) - log(min)
- Min = $100, Max = $75,000
Final HDI = ∛(Health × Education × Income)
Nepal's HDI 2021: 0.602 (Medium Human Development)
HDI Categories:
- Very High: 0.800 and above (Norway, Switzerland)
- High: 0.700-0.799 (China, Brazil)
- Medium: 0.550-0.699 (Nepal, India, Bangladesh)
- Low: Below 0.550 (Afghanistan, Niger)
3.4 Basic Needs Approach
- Eight Basic Needs:
- Food: Adequate nutrition
- Water: Clean drinking water
- Shelter: Proper housing
- Health: Basic healthcare
- Education: Primary education
- Employment: Job opportunities
- Clothing: Basic clothing
- Security: Personal safety
- If all citizens have these → Developed country
3.5 Sustainable Development Indicators
Three Pillars:
- Economic: Growth, employment
- Social: Equality, education, health
- Environmental: Clean air, water, forests
SDGs: 17 Sustainable Development Goals by UN
Unit 4: Features of Nepalese Economy
4.1 Agriculture-Based Economy
- 68% population engaged in agriculture
- 24% of GDP from agriculture (2022)
- Subsistence farming: Grow for own consumption
- Low productivity: Traditional methods, small land
- Monsoon dependent: Rain-fed agriculture
4.2 Lack of Industrial Development
- Only 5.8% of GDP from manufacturing
- Small-scale industries: Mostly cottage industries
Problems:
- Lack of capital
- Poor infrastructure
- Political instability
- Limited market
4.3 Underutilization of Natural Resources
- Water Resources:
- Potential: 83,000 MW hydroelectricity
- Developed: Only 2,100 MW (2.5%)
- Forests: 44.7% area forested, but not properly managed
- Minerals: Limestone, magnesite, but limited mining
4.4 Low Capital Formation
- Savings Rate: 38.4% of GDP (good but...)
- Investment Rate: 34.2% of GDP
- Problem: Savings not converted to productive investment
- Vicious Circle of Poverty:
Low income → Low savings → Low investment → Low production → Low income
4.5 High Dependency on Foreign Aid
- 30% of annual budget from foreign aid
- Remittances: 23% of GDP (from workers abroad)
- Problems:
- Donor-driven priorities
- Temporary solutions
- Debt burden
4.6 Technological Backwardness
- R&D Expenditure: 0.3% of GDP (very low)
- Digital Divide: Urban vs rural
- Traditional methods in agriculture
4.7 Unfavorable Balance of Trade
- Exports: $1.2 billion (2022)
- Imports: $15.6 billion (2022)
- Trade Deficit: $14.4 billion
- Major Imports: Petroleum, machinery, vehicles
- Major Exports: Woolen carpets, garments, pulses
4.8 Unemployment and Underemployment
- Unemployment Rate: 11.4% (2022)
- Underemployment: Working less than capable
- Disguised Unemployment: Appear employed but contribute little
- Youth Unemployment: 19.2% (15-29 years)
4.9 Unequal Distribution
- Gini Coefficient: 32.8 (moderate inequality)
- Top 10% own 26.5% of wealth
- Bottom 40% own 16.3% of wealth
- Urban-Rural Divide: Kathmandu vs remote villages
4.10 Landlocked Country
- No sea access: Must use Indian ports
- Transport costs high: Increases price of goods
- Political dependence: On neighbors for trade routes
Unit 5: Major Theories of Economic Development
5.1 Classical Theory of Economic Development
Main Thinkers: Adam Smith, David Ricardo, Thomas Malthus
Key Principles:
1. Laissez-Faire Policy:
- "Let it be" in French
- Minimum government interference
- Free market competition
- Private property rights
2. Capital Accumulation:
- Save money → Invest in machinery → Increase production
- Example: A farmer saves, buys tractor, produces more
3. Division of Labor:
- Specialization increases efficiency
Adam Smith's pin factory example: One worker makes whole pin = 20/day; 10 specialized workers = 48,000/day
4. Profit Motive:
- Profit encourages investment
- More profit → More investment → More growth
5. Stationary State:
- Economy grows until it reaches limit
- Then stops growing (stationary state)
- Due to: Limited resources, population pressure
6. Population Theory (Malthus):
- Population grows geometrically (2,4,8,16...)
- Food grows arithmetically (2,4,6,8...)
- Result: Poverty, famine unless controlled
Relevance to Nepal:
- Need for capital accumulation
- Importance of savings
- But laissez-faire may not work (needs government help)
5.2 Marxist Theory of Economic Development
Main Thinker: Karl Marx (1818-1883)
Key Concepts:
1. Historical Materialism:
- History is struggle between classes
- Stages: Primitive → Slavery → Feudalism → Capitalism → Socialism → Communism
2. Class Struggle:
- Bourgeoisie: Capitalist class (factory owners)
- Proletariat: Working class
- Constant conflict between them
3. Surplus Value Theory:
- Workers create more value than paid
- Example: Worker paid $50/day, produces goods worth $100
- Surplus Value = $50 (goes to capitalist as profit)
- This is exploitation
4. Capitalist Crisis:
- Overproduction → Unsold goods → Factory closure → Unemployment
- Rich get richer, poor get poorer
- Revolution inevitable
5. Dictatorship of Proletariat:
- Workers take control
- Abolish private property
- "From each according to ability, to each according to need"
Relevance to Nepal:
- Explains inequality
- Need for workers' rights
- But complete Marxism not practical for Nepal
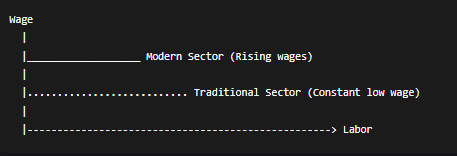
5.3 Lewis Theory of Unlimited Supply of Labor
Main Thinker: W. Arthur Lewis (Nobel Prize 1979)
Main Model: Two-Sector Model
Sector 1: Traditional Agriculture
- Low productivity
- Surplus labor (unlimited supply)
- Low wages
- Disguised unemployment: Remove some workers, output same
Sector 2: Modern Industry
- High productivity
- Needs workers
- Pays higher wages
Process of Development:
Step 1: Industry offers wage slightly above agriculture
Step 2: Workers move from farms to factories
Step 3: Agriculture productivity increases (fewer workers, same land)
Step 4: Industry expands with cheap labor
Step 5: Profits reinvested → More factories → More jobs
Step 6: Eventually, labor shortage → Wages rise → Development
Graphical Representation:
Assumptions:
- Unlimited labor in agriculture
- Capitalists reinvest profits
- Technology constant initially
- Closed economy (no migration)
Relevance to Nepal:
- Explains migration from villages to cities
- Need for industrial growth
- Problem: Nepal's industry not growing fast enough
Unit 6: Current Development Status of Nepal
Economic Indicators (2022/23):
- GDP: $36 billion
- GDP Growth: 4.1%
- Per Capita Income: $1,200
- Inflation: 7.3%
- Unemployment: 11.4%
Social Indicators:
- Life Expectancy: 71 years
- Literacy Rate: 68%
- School Enrollment: 97% (primary)
- Access to Electricity: 90%
- Access to Clean Water: 89%
Human Development:
- HDI Rank: 143rd out of 191 countries
- HDI Value: 0.602 (Medium)
- Gender Inequality Index: 0.452 (Medium)
Challenges:
- Political instability: Frequent government changes
- Poor infrastructure: Roads, electricity, internet
- Corruption: Transparency Index rank 110/180
- Brain drain: Educated youth going abroad
- Climate vulnerability: Floods, landslides
Opportunities:
- Hydropower: Can be energy exporter
- Tourism: Natural beauty, mountains
- Agriculture: Organic farming potential
- Youth population: 40% below 25 years
- Remittances: Source of investment capital
Unit 7: Role of Different Sectors in Nepal's Development
7.1 Agriculture Sector:
Problems:
- Small land holdings (0.8 hectare average)
- Traditional methods
- Lack of irrigation (only 50% irrigated)
- Climate change effects
Solutions:
- Commercial farming
- Irrigation projects
- Cooperatives
- Organic certification
7.2 Industrial Sector:
Potential Industries:
- Hydropower: Export to India, Bangladesh
- Tourism: Adventure, religious, cultural
- IT Services: BPO, software development
- Herbal products: Ayurvedic medicines
Government Initiatives:
- Special Economic Zones (SEZs)
- Tax incentives for industries
- Export promotion
7.3 Service Sector:
54% of GDP
Growing: Education, health, tourism, IT
Opportunity: Digital Nepal framework
Important Formulas for Calculation:
1. Per Capita Income:

2. GDP Growth Rate:

3. HDI Calculation (Simplified):
Key Takeaways:
- Development = Growth + Social progress
- Nepal needs balanced development
- Education and health are foundations
- Sustainable development is crucial
- Every citizen has role in development