Cost and Revenue Curves - Grade 10 Economics
Complete Notes with Definitions and Diagrams
As Per Nepal Government Curriculum
Unit 1: Cost and Cost Curves
1.1 Definition of Cost
Cost refers to all the expenses made by a producer while producing goods and services. These expenses include payments for factors of production like land, labour, capital and entrepreneurship.
Example:
To produce a table, expenses include:
Wood and nails (raw materials) → Variable cost
Worker’s wages (labour) → Variable cost
Rent for workshop (land) → Fixed cost
Machine cost (capital) → Fixed cost
1.2 Types of Costs
A. Short-run Costs
Short run is a time period in which some factors are fixed and some are variable.
Fixed Cost (FC):
Costs that do not change with output level.
Examples: Rent, salary, interest on loan.
Remains same even if production is zero.
Variable Cost (VC):
Costs that change with output level.
Examples: Raw materials, wages for daily workers, electricity.
Zero when output is zero.
B. Total Costs (Short Run)
TypeFormulaMeaningTotal Fixed Cost (TFC)
TypeFormulaMeaningTotal Fixed Cost (TFC)–Sum of all fixed costsTotal Variable Cost (TVC)–Sum of all variable costsTotal Cost (TC)TC = TFC + TVCSum of TFC and TVC
Table Example:
Output (Units)TFC (Rs.)TVC (Rs.)TC (Rs.)060060160309026040100360451054605511556075135660120180
Diagram of Total Costs:
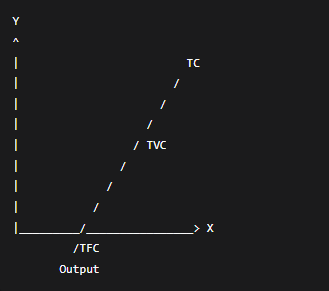
TFC: Horizontal straight line
TVC: Starts from origin, slopes upward
TC: Parallel to TVC but starts from TFC level
C. Average Costs
Average Fixed Cost (AFC):
Fixed cost per unit.
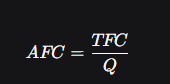
Always decreases as output increases.
Average Variable Cost (AVC):
Variable cost per unit.
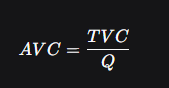
U-shaped curve.
Average Total Cost (ATC):
Total cost per unit.
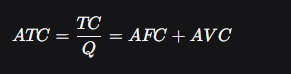
U-shaped curve.
Table Example:
QTFCTVCTCAFCAVCATC16030906030902604010030205036045105201535460551151513.7528.7556075135121527660120180102030
Diagram of Average Costs:
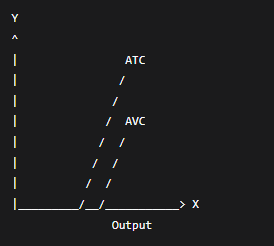
AFC: Downward sloping curve
AVC: U-shaped, minimum earlier
ATC: U-shaped, above AVC
D. Marginal Cost (MC)
Definition:
The additional cost of producing one more unit of output.
Formula:

Important:
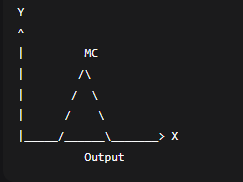
MC curve is U-shaped.
MC cuts AVC and ATC at their minimum points.
Table Example:
OutputTCMC190–21001031055411510513520618045
Diagram:
Unit 2: Revenue Curves
2.1 Definition of Revenue
Revenue is the total money a firm receives from selling goods and services.
Types of Revenue
Total Revenue (TR):
Total money from selling all units.
- TR=Price×Quantity=P×QTR=Price×Quantity=P×Q

Average Revenue (AR):
Revenue per unit sold.
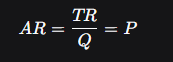
AR is always equal to price.
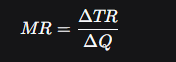
Marginal Revenue (MR):
Additional revenue from selling one more unit.
2.2 Revenue under Perfect Competition
Perfect Competition Market Features:
Many buyers and sellers
Single uniform price
Firm is price taker
AR = MR = Price (constant)
Table Example:
QPrice (Rs.)TR (Rs.)MR (Rs.)1555251053515545205
Diagram:
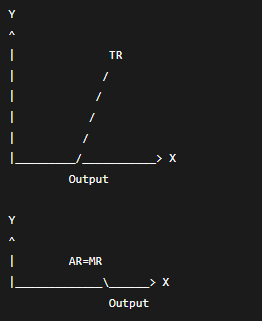
TR: Straight line from origin
AR=MR: Horizontal line
2.3 Revenue under Monopoly
Monopoly Market Features:
Single seller
Price maker
To sell more, must lower price
AR curve = Demand curve (downward sloping)
MR curve is below AR
Table Example:
QPrice (Rs.)TR (Rs.)MR (Rs.)11010–2918838246472845630265300
Diagram:
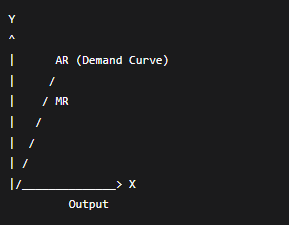
AR: Downward sloping
MR: Also downward sloping, but below AR
3. Important Formulas Summary
ConceptFormulaTCTFC + TVCAFCTFC / QAVCTVC / QATCTC / Q = AFC + AVCMCΔTC / ΔQTRP × QARTR / Q = PMRΔTR / ΔQ
4. Key Points to Remember
Fixed Cost: Does not change with output.
Variable Cost: Changes with output.
Short Run: Both fixed and variable costs exist.
Average Cost Curves: U-shaped due to laws of returns.
MC cuts AVC & ATC at their minimum points.
Perfect Competition: Price constant, AR=MR.
Monopoly: Price decreases to sell more, MR < AR.