1.What is Statistics?
Statistics is the study of collecting, organizing, summarizing, and interpreting data.
2.Types of Data
Primary Data: Collected for the first time by the researcher
Secondary Data: Already collected by someone else (books, websites, records)
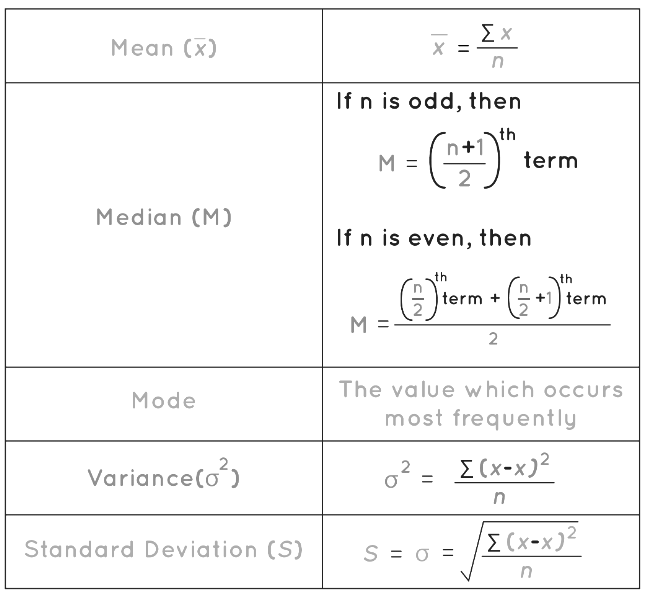
3. Mean (Average)
Concept:
The mean is the sum of all observations divided by the total number of observations. It gives the central value of the data.
Formula (for individual data):
Mean = Sum of all observations / Number of observations
Example 1:
Marks obtained by 5 students: 12, 15, 18, 20, 25
Mean = (12 + 15 + 18 + 20 + 25) / 5 = 90 / 5 = 18
Mean for frequency distribution:
Mean = Sum of (frequency × value) / Sum of frequencies
Example 2:
| Marks (X) | Frequency (f) | f × X |
|---|---|---|
| 10 | 3 | 30 |
| 20 | 4 | 80 |
| 30 | 3 | 90 |
| Total | 10 | 200 |
Mean = 200 / 10 = 20
Mean by assumed mean method:
Choose an assumed mean A
Find deviations d = X - A
Multiply deviations by frequency: f × d
Mean = A + Sum(f × d) / Sum(f)
Example 3:
| Marks (X) | Frequency(f) | d = X-20 | f × d |
|---|---|---|---|
| 10 | 3 | -10 | -30 |
| 20 | 4 | 0 | 0 |
| 30 | 3 | 10 | 30 |
| Total | 10 | 0 |
Mean = 20 + 0 / 10 = 20
4. Median
Concept:
Median is the middle value that divides the data into two equal parts.
For individual data:
Arrange data in ascending order
If number of observations n is odd, median is the middle value
If n is even, median is the average of the two middle values
Example 1:
Data: 12, 15, 18, 20, 25
Median = 18 (middle value)
For grouped data:
Median = L + ((N/2 - CF) / f) × h
Where
L = lower limit of median class
N = total frequency
CF = cumulative frequency before median class
f = frequency of median class
h = class width
Example 2:
| Marks | Frequency(f) | Less than CF |
|---|---|---|
| 0-10 | 3 | 3 |
| 10-20 | 5 | 8 |
| 20-30 | 6 | 14 |
| 30-40 | 4 | 18 |
| Total | 18 |
Position of median = N/2 = 18/2 = 9th term
Median class = 10-20
L = 10, CF = 3, f = 5, h = 10
Median = 10 + ((9 - 3) / 5) × 10 = 10 + 6 / 5 × 10 = 10 + 12 = 22
5. Mode
Concept:
Mode is the value that occurs most frequently.
For individual data:
Look for the number that appears maximum times
Example 1:
Data: 10, 12, 15, 12, 20, 12, 18
Mode = 12 (appears 3 times)
For grouped data:
Mode = L + ((f1 - f0) / (2 × f1 - f0 - f2)) × h
Where
L = lower limit of modal class
f1 = frequency of modal class
f0 = frequency of class before modal class
f2 = frequency of class after modal class
h = class width
Example 2:
| Marks | Frequency(f) |
|---|---|
| 10-20 | 5 |
| 20-30 | 8 |
| 30-40 | 12 |
| 40-50 | 6 |
Modal class = 30-40
L = 30, f1 = 12, f0 = 8, f2 = 6, h = 10
Mode = 30 + ((12-8)/(2×12 - 8 - 6)) × 10 = 30 + (4/10) × 10 = 30 + 4 = 34
6. Quartiles
Concept:
Quartiles divide the data into four equal parts:
Q1 = first quartile = 25% of data
Q2 = median = 50% of data
Q3 = third quartile = 75% of data
Position formula for discrete data:
Q1 = (N+1)/4 th term
Q3 = 3(N+1)/4 th term
Example 1:
Data: 10, 12, 15, 18, 20, 22, 25, 28
N = 8
Q1 = (8+1)/4 = 9/4 = 2.25th term → 2nd term + 0.25 × (3rd term - 2nd term)
Q1 = 12 + 0.25 × (15 - 12) = 12 + 0.75 = 12.75
Q3 = 3 × (8+1)/4 = 27/4 = 6.75th term → 6th term + 0.75 × (7th - 6th)
Q3 = 22 + 0.75 × (25 - 22) = 22 + 2.25 = 24.25
For grouped data:
Q1 = L + ((N/4 - CF) / f) × h
Q3 = L + ((3N/4 - CF) / f) × h
Example 2:
| Marks | Frequency(f) | CF |
|---|---|---|
| 0-10 | 5 | 5 |
| 10-20 | 8 | 13 |
| 20-30 | 12 | 25 |
| 30-40 | 5 | 30 |
| Total N=30 |
Q1 position = N/4 = 30/4 = 7.5th term → 10-20 class
L = 10, CF = 5, f = 8, h = 10
Q1 = 10 + ((7.5-5)/8) × 10 = 10 + 3.125 = 13.125
Q3 position = 3N/4 = 22.5th term → 20-30 class
L = 20, CF = 13, f = 12, h = 10
Q3 = 20 + ((22.5-13)/12) × 10 = 20 + 7.92 = 27.92
7 Common & Important Questions (with Answers)
Q1. Find the mean of 5, 10, 15, 20
Sum = 50, Mean = 50 ÷ 4 = 12.5
Q2. Find the median of 8, 3, 5, 2, 9
Ordered: 2, 3, 5, 8, 9 → Median = 5
Q3. Find the mode of 4, 6, 7, 4, 8, 4, 9
Most repeated value = 4
Q4. Find the range of 12, 18, 25, 10, 20
Range = 25 − 10 = 15
Q5. For data 4, 6, 8, 10, find Q1, Q2, Q3
Ordered: 4, 6, 8, 10
Q2 = (6+8)/2 = 7
Q1 = (4+6)/2 = 5
Q6. Marks of 27 students: 25, 15, 30, 22, 27, 12, 25, 30, 22, 24, 15, 23, 19, 27, 28, 17, 19, 22, 25, 15, 14, 13, 28, 26, 18, 20, 22
Mean = sum/N = 568/27 ≈ 21.04
Median = 14th term = 22
Mode = 22 (appears 4 times)
Q1 = 25% of 27 → 7th term = 17
Q3 = 75% of 27 → 20th term = 27
Q7. Find Q1 and Q3 from grouped data:
| Marks | f | CF |
|---|---|---|
| 0-10 | 5 | 5 |
| 10-20 | 10 | 15 |
| 20-30 | 12 | 27 |
| 30-40 | 8 | 35 |
| Total N=35 |
Q1 = 0-10? N/4=35/4≈8.75th → 10-20 class
L=10, CF=5, f=10, h=10
Q1 = 10 + ((8.75-5)/10) × 10 = 13.75
Q3 = 3N/4 = 26.25th → 20-30 class
L=20, CF=15, f=12, h=10
Q3 = 20 + ((26.25-15)/12) × 10 ≈ 29.38
Summary Table
| Measure | Formula | Example |
|---|---|---|
| Mean | Sum / N or Sum(f × X)/Sum(f) | Mean of 10,20,30 = 20 |
| Median | Middle value or L + ((N/2 - CF)/f) × h | Median of grouped data = 22 |
| Mode | Most frequent or L + ((f1-f0)/(2f1-f0-f2)) × h | Mode of grouped data = 34 |
| Q1 | L + ((N/4 - CF)/f) × h | Q1 = 13.125 |
| Q3 | L + ((3N/4 - CF)/f) × h | Q3 = 27.92 |
Visit this link for further practice!!
https://besidedegree.com/exam/s/academic